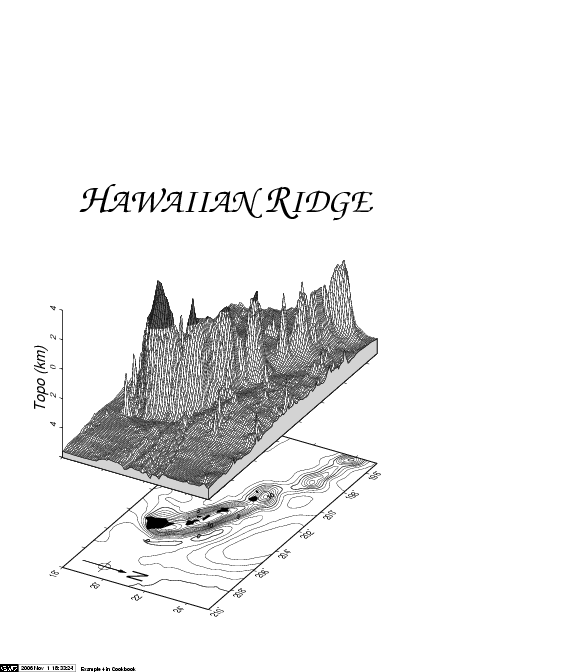
Example 4. Layer cake illustration of the bathymetric expression and the altimetric
sea-surface height of the Hawaiian island chain. The data is the same used in Example 2.
The composite color PostScript figure was created with the GMT programs grdview, pscoast,
and psbasemap and converted to a rasterfile. The illumination is from the north, and
the color intensity variations are based on gradients of the data using grdgradient.

